MENU
K Shotliff*, G Duncan, R Dewhirst, L Dixon, A Ellingford, R Greenwood, J Mansell, P Mitchell, G Moss; on behalf of the British Association of Retinal Screeners Council
| ABSTRACT The aim of this survey was to determine the number of patients being screened per session in UK diabetic retinal screening programmes and the number of patients images being graded in stand alone grading sessions. A questionnaire was sent to all members of the British Association of Retinal Screeners asking for information about diabetic retinal screening schemes in which they were involved. Sixty-eight (31%) replied and suggested that an average of 14.4 patients were being screened per session on a fixed site programme, and an average of 15.7 per session with a mobile service. A standard morning session was, on average, 3 hours and 23 minutes long on a fixed site and 3 hours and 14 minutes on a mobile site. A standard afternoon session was, on average, 3 hours and 5 minutes long on a fixed site and 2 hours and 44 minutes long on a mobile site. Those undertaking grading as a stand alone activity screened an average of 39.3 patients per session (ranging from 20–75 patients per session). While the lengths of morning and afternoon screening sessions were relatively consistent there was more variability in the number of patients whom a stand alone grader would typically grade per session. We believe this range of activity reinforces the importance of a good quality assurance programme to maintain the consistency of the service offered. Copyright © 2010 John Wiley & Sons KEY WORDS diabetic retinopathy; screening; workload |
A structured screening programme for diabetic retinopathy available to all people with diabetes, aiming for the early detection of asymptomatic individuals allowing for early treatment to try and reduce any loss of vision, is now a well accepted and achievable ideal.1,2 The National Service Framework (NSF) for diabetes suggested diabetic retinopathy screening as an area to target more aggressively, aiming for 100% of people with diabetes being offered annual retinal screening by 2007.1 Primary care trusts (PCTs) and strategic health authorities (SHAs) have been charged with achieving and maintaining this screening programme.
The English National Screening Programme for Diabetic Retinopathy (ENSPDR) suggests digital photography is the current method of choice.2 The effectiveness of digital images in comparison to standard 35mm photographs and their lower technical failure rate is now well accepted, as is the role of trained professionals grading the images obtained. The ENSPDR provides accepted, structured grading criteria for the images obtained, as well as setting minimum standards for the quality of the image used, the maximum accept- able technical failure rate of the screening system implemented and the need for quality assurance of the whole grading process.2 For individuals grading these retinal images there is an accredited City and Guilds qualification aiming to ensure all individuals and the grading system within which they work are up to a certain level of competence – i.e. have a suitable standard of sensitivity and specificity with suitable quality assurance.3,4
We have, however, seen no guidance on how many people one person should be expected to screen whilst trying to achieve these standards, and therefore wished to find out about current practice in UK retinal screening programmes, by asking current members of the British Association of Retinal Screeners (BARS). This may then be helpful in future job planning and when reviewing current grader posts.
There are currently 107 diabetic retinopathy screening programmes in the UK. The membership of BARS consists of individuals with an interest in diabetic retinopathy screening. Most are involved, or have an interest in, the screening of people with diabetes in schemes being undertaken in the UK as well as a small number of foreign affiliates involved in screening programmes abroad. The UK membership includes retinal graders – such as photographers, optometrists, ophthalmology and diabetes nurses – as well as screening programme managers, PCT/SHA commissioners, general practition- ers, diabetologists and ophthalmologists involved in diabetic retinopathy services and clinics into which these screening programmes feed patients with abnormal results.
We sent a questionnaire to all 220 UK members of BARS (175 of whom are registered with BARS as being ‘graders') asking them about the screening programme that they are involved in, specifically asking if they undertook the image collection and the grading of those images. We asked for information about:
Sixty-eight individuals replied to our questionnaire (31% of those contacted, 39% of those registered with BARS as being ‘graders') stating that they undertook these activities.
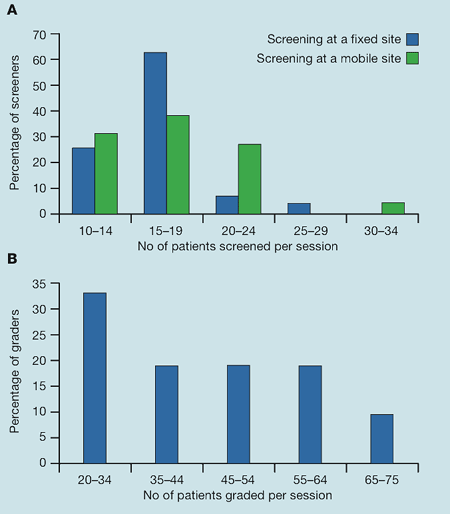 |
| Figure 1. (A) Patients screened per session with no grading at the time of image collection on a fixed site and using a mobile screening site. (B) Number of patients' images which are graded per session in a stand alone session |
The eye contains the only easily visible vascular bed affected by diabetes. Helmholtz invented the direct ophthalmoscope in 1851 with the first report of retinal abnormalities in the eyes of a patient with diabetes four years later. Interestingly, these were actually hypertensive changes rather than diabetic, reinforcing the need for a standardised grading scheme and a suitable quality assurance programme.
Digital photography is currently the investigation of choice for retinal screening in a diabetic population. It allows grading of the images obtained to separate those who just need to be recalled for annual screening (e.g. grades R0M0 and R1M0) from those who require referral to an ophthalmologist with a special interest in diabetes for further investigation and treatment; it also highlights those patients in whom we should be more aggressively improving medical parameters such as blood pressure and glycaemic control.
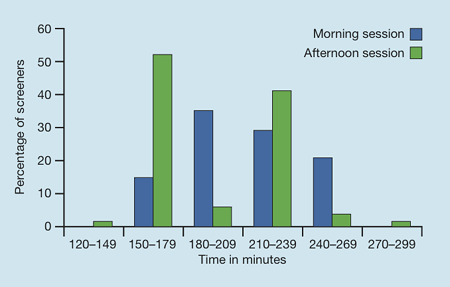 |
| Figure 2. Reported time taken in minutes for a morning session and an afternoon session of retinal screening using digital photography |
Key points
|
There is a great deal of information and advice available relating to the training and the expected level of competence needed by all individuals involved in the screening of people with diabetes for diabetic retinopathy. However, there is little about the time needed or expected to undertake this activity.2–4 This lack of information on the expectation of what a standard ser vice should be asking its screeners and graders to be doing has led to much discussion at several of the recent annual BARS conferences.
The limitations of this study are the relatively low response rate and the fact that not all screening services were represented, with some centres potentially having more than one individual replying on their behalf. The study was not designed to clarify which screening ser vice the individual completing the survey worked for; any further studies in this area should determine this and use an average of the responses from each centre to determine a better representation, and also obtain replies from all diabetic retinopathy screening services to see if these results are consistent across the UK. As shown in Figure 1, there was not a normal distribution of the data for the number of patients screened or graded, which without those extremes may have given a more consistent pattern of numbers of individuals being screened and graded. The anonymous data from the different screening and grading centres also made it difficult to determine as to why there were different lengths of screening sessions, travelling times and stand alone grading being undertaken.
This study does, however, suggest, from the people who did reply, that there are relatively consistent numbers of individuals whom one might expect to be screened in a screening session and for the length of that session, particularly if the relatively small percentage of higher numbers of patients being screened is excluded. However, there appears to be a wider variation in the time allocated/taken to grade the images obtained when undertaken as a stand alone activity. On average, nearly 12 patients' images were graded per hour by those people who undertake stand alone grading – i.e. an average of 39.3 images/patients graded with 3 hours 14 minutes for the average half day grading session, which equates to one person's images being graded every 5 minutes. However, this varied between centres/individuals from almost 2.5 minutes per patient (i.e. 75 per session) to 10 minutes per patient screened (i.e. 20 per session).
While we accept that some people are quicker than others in their ability to grade retinal images and that some of the software used to obtain the images may be a little slower than others, the importance of accurate grading – however long it takes – for the subsequent management of these people with diabetes goes without saying. The variability we found in the time allocated to undertake this activity reinforces the importance of a robust quality assurance pro- gramme. Such a programme would make sure that this grading is not being rushed due to the workload being given to graders or slowed down by software issues, and would at the same time ensure that the grading still meets national quality standards. We would therefore strongly recommend anyone involved in the management and quality assurance of a retinal screening scheme to look at this area of their service carefully – not just at individual graders but also at the software being used to extract, view and save the images and their reports. This is because, if that explained the difference in the number of patients' eyes graded, then efficiency may be improved without any reduction in quality.
There are no conflicts of interest.
1 www.doh.gov.uk/NSF/diabetes
2 www.retinalscreening.nhs.uk
3 www.eyescreening.org.uk
4 www.cityandguilds.com/documents/7359-diabetic-retinopathy-screening
*Correspondence to: Dr Kevin Shotliff, Consultant Physician, Beta Cell Diabetes
Centre, Chelsea and Westminster Hospital, 369 Fulham Road, London SW10 9NH, UK; e-mail: kevin.shotliff@chelwest.nhs.uk
The original article is available as a pdf here »
Received: 9 September 2009 Accepted in revised form: 4 February 2010
154 Pract Diab Int May 2010 Vol. 27 No. 4 copyright © 2010 John Wiley & Sons